04 de julio de 2024

2024 Wenas Audubon hike and campout

My journey at the 2024 Wenas Audubon campout at Cascade Park camp in the Wenas Wildlife Area of Central Washington [1][2][3] was more than just a solo adventure. Surrounded by 120 fellow bird watchers, we formed a close-knit community of naturalists. Despite my role as a 'weed watcher,' I was never alone; friends and their friends always surrounded me. Our camp was an enclave of seven within the larger Audubon group gathered from across Washington State.

The first evening talk started with a list of bird species seen during the day and an overview of the campout, including a list of hikes for the next day. I determined I would go on the "adventure hike" or, as some campers named it: "the death march”; that sounded like my hike.

Next, Greg Mackey, the Oak Creek Area Wildlife Manager for the Washington Department of Fish & Wildlife, talked about the history of elk in Central Washington and how the management of elk herds works today. Elk had been in the region but were killed in the 19th century by settlers. Hunters imported fifty Rocky Mountain elk in 1913. The herd grew to several thousand. The state assembled land holdings to provide wilderness habitat for the elk. One challenge was that the elk would move into the lowlands of the Yakima Valley to graze in the winter, causing crop damage. Washington State started a winter feeding program in several areas, including Oak Creek, to keep the elk out of crops. Greg gave an informative talk, and I learned about the challenges of wildlife management in our state. [4][5][6][7][8]

I was up at sunrise the following day. It was a bit chilly. I brewed instant coffee with my Jetboil stove and viewed the camp waking up with the birds. I had my premade cereal, blueberries, and nuts, which I had cold-soaked the night before; it was delicious. My friends woke up, and three of us headed for the adventure hike rendezvous at 7 AM. We met our hike leader, Jack, and 16 fellow hikers.

We started on a road that followed Dry Creek's path. We walked in a Pinus ponderosa (Ponderosa pine) forest with sagebrush growing interspersed. I closely observed one of the Ponderosa pines; the small male cones were visible. I also saw Artemisia rigida (Scabland Sagebrush), but I need to confirm my ID. One of the first finds was a fallen nest. A few feathers are visible—maybe Genus Spizella (sparrow) feathers?
I also saw a series of flowers and shrubs in bloom:

  • Pale blue Iris missouriensis (Western Blue Flag)
  • Bright yellow Wyethia amplexicaulis (Northern Mule's Ears)
  • White Crataegus douglasii (Black Hawthorn)
  • Cream Ribes cereum (Wax Currant)
  • Bright blue Triteleia grandiflora (Large-flowered Triteleia)
  • White Toxicoscordion paniculatum (Foothill Deathcamas)
  • Yellow Castilleja thompsonii (Thompson's Indian Paintbrush)

I got some help from fellow hiker Anna on the Wyethia amplexicaulis identification. Initially, I thought it was in the genus Balsamorhiza. Anna pointed out the multiple flower heads and leaves along the flower stem (cauline leaves),

in contrast to Balsamorhiza sagittata (arrowleaf balsamroot), which usually has a single flower head. I can also see that W. amplexicaulis has shiny green leaves in contrast to Balsamorhiza's gray-green leaves. I should have looked closer; perhaps I needed a second cup of coffee this morning!

While on the Dry Creek segment of the hike, I observed a new moth, Scopula junctaria (Simple Wave), resting on some lupine leaves.

Side note: I should have added an observation of the lupine, but I find lupines a challenge to ID, so I skipped it. Of course, lupines are essential to an ecosystem as they fix nitrogen in the soil. Still, I tend to undersample lupines greatly.

We turned from the flat trail along Dry Creek and headed upward; we had been walking for about an hour. I noticed most of my fellow hikers were ahead of me, so I used the uphill section to catch up. Birders walk slightly faster than botanists (but only a little quicker). I noticedPseudotsuga menziesii (Douglas Fir) trees and Delphinium nuttallianum (Upland Larkspur) in flower.

The trail suddenly grew steeper. I stopped for a breather and saw some red bracts of Castilleja hispida (Harsh Paintbrush). After more climbing, we reached an open meadow. Our group took a break; I used the time to explore the meadow. I first noticed the larger plants: Eriogonum douglasii (Douglas' Buckwheat), Erigeron linearis (Desert Yellow Fleabane), Balsamorhiza (Balsamroots), andArtemisia tripartita (Threetip Sagebrush). I noticed the association of Castilleja thompsonii and A. tripartita growing together; I'll have more to say about this later. There was also Poa bulbosa (Bulbous Bluegrass), an invasive grass in the area. The soil in this area was dry and rocky.

The habitat in this area consists of open meadows at the top of hills bordered by Ponderosa pines, a pattern that repeats in the surrounding hills. I entered the forest border and observed a Pinus ponderosa (Ponderosa Pine) with fluorescent green Genus Letharia (Wolf Lichens) covering the lower branches.

I spotted a yellow and black beetle on an Eriogonum douglasii flower. I assumed the beetle was consuming the flower and serving as a pollinator.

When I got home, I identified this as a Trichodes ornatus (Ornate Checkered Beetle). I was curious and did some research. First, I read Pollinator of the Month: Ornate checkered beetle (Trichoda ornatus) [9], a website on the importance of beetles as pollinators [10] and then the paper Observations on the Life History of Trichodes Ornatus by Linsley and Macswain [11] which was available at Cornell Library. I found that T. ornatus has a remarkable year-long life cycle:


T. ornatus year-long life cycle
  1. Adult T. ornatus lays eggs on flower heads
  2. Eggs hatch after 20 days, and beetle larvae emerge
  3. Bee or wasp (order Hymenoptera) visit flower to pollinate
  4. Beetle larva attach to leg of Hymenoptera
  5. Hymenoptera returns to nest with stowaway larva
  6. Beetle larva enters open cell in Hymenoptera nest
  7. Hymenoptera provisions open cell and seals it
  8. T. ornatus larva eats Hymenoptera larva
  9. T. ornatus larva pupates during winter and emerges in spring
  10. Adult T. ornatus emerge; find flowers and small beetles to eat
  11. Female and male mate on flowers; female may consume male

In the same area as the T. ornatus beetle, I noticed a small Ichneumonidae (Ichneumonid) wasp exploring a Balsamorhiza, perhaps looking for prey. This wasp's nest might host a T. ornatus larva.

There were also abundant grasshoppers in the grass; I noticed a pair of Bradynotes obesa (Slow Mountain Grasshopper) mating. I saw many of these grasshoppers up on the ridge; they became more active as the morning sun started heating the area; it was about 20 C (68 F) at 9 AM.

Interspersed in the meadow were Trifolium macrocephalum (Bighead Clover); these had all set seed. I also noticed a hoverfly (Tribe Syrphini) flying around an Eriogonum douglasii, perhaps looking for aphids. It was very challenging to capture a photo of this fast-moving syrphid.
The group moved along a flat plateau after about 25 minutes in the meadow. We spent the next three hours exploring this area. After a few minutes, I noticed fritillary butterflies all around me. I caught an Argynnis callippe (Callippe Fritillary) on yellow Erigeron linearis (Desert Yellow Fleabane) flowers. Three species of buckwheat were growing on the plateau: Eriogonum compositum (Arrowleaf Buckwheat), Eriogonum thymoides (Thymeleaf Buckwheat), and Eriogonum douglasii (Douglas' Buckwheat).

While posting an observation of Eriogonum compositum, I noticed ten small Anthrenus Lepidus beetles interacting with the flowers. The beetles were eating the flower and also pollinating it. Unfortunately, I didn't see these beetles until looking at my photos at home.
I saw about 20 Phobetus comatus scarab beetles in a one-meter square area. I think these beetles had recently emerged.

About an hour later, we found the scat of a mammal, possibly
coyote scat, containing the elytra of about P. comatus 50-100 beetles.

Several of us dissected the scat, and afterward, I was treated to a rendition of the Scat Rap chorus [12] by our hike leader and several fellow naturalists:
"It starts with an "s," and it ends with a "t."
It comes out of you and comes out of me
I know what you're thinking; you can call it that
But let's be scientific and call it scat."

I found some other relevant verses when I got home:
Down the trail, something's lying on the ground
Nature's tootsie roll all long and brown
Don't wrinkle your nose, don't lose your lunch
Break it apart; you might learn a bunch
Don't use your fingers, use a stick
Keep it sanitary now; that's the trick

If you want to find out what animals eat
Take a good look at what they excrete
Stuck in the scat are all kinds of clues
Parts of the food their bodies can't use
Like bones and fur (2x)
Hard berries and seeds (2x)
Crawfish shells, ouch! (2x)
Grass fibers and weeds (2x)

I observed several plants on the ridge that were new for this hike:

  • Purple flower buds of Allium acuminatum (Hooker's Onion)
  • Pink flowers of Erigeron poliospermus (Hairy-seed Fleabane)
  • Penstemon gairdneri (Gairdner's Beardtongue) with pink flowers
  • Pale yellow-flowered Lithospermum ruderale Western Stoneseed was a plant I saw for the first time.
  • Pale pink flowers of Symphoricarpos rotundifolius (Roundleaf Snowberry)
  • Pale yellow flower of Tragopogon dubius (Yellow Salsify)
  • Another first observation was the cream-colored flowers and unique seeds of Astragalus reventiformis (Yakima Milkvetch). I found Jim Thomas's simplified identification guide helpful[13]
  • White-flowered Silene douglasii (Douglas' Catchfly)

In this area, I found Castilleja thompsonii was growing in association with Erigeron linearis (Desert Yellow Fleabane). The genus Castilleja is hemiparasitic; they get water and nutrients but not carbon from their host plant. Throughout the hike, I observed C. thompsonii growing with:

  • Artemisia (4)
  • Lupine (2)
  • Erigeron linearis (1)
  • no associated plant (1)

"According to some sources C. thompsonii is nearly always parasitic on sagebrushes (especially A. rigida ), but I have also observed them many times without any sagebrush even remotely close by. The association with A. rigida I suspect is just shared soil habitat (although of course they could be one host)." [14]

Here's a bit more detail about hemiparasitic plants:
"Hemiparasitic plants withdraw resources from the vascular system of their hosts through a specialized transfer organ called haustorium. Hemiparasites attack the host's xylem, in contrast to the holoparasites that infect both phloem and xylem and as a consequence, hemiparasitic plants have access to water and mineral nutrients but little carbon. Due to their reduced or non-existing root networks, hemiparasitic plants acquire virtually all mineral nutrients and water from the host. At the same time, organic carbon is provided, at least in part, by their photosynthetic activity."[15]

We witnessed a predator-prey interaction, first spotted by @sydnianajones : a robber fly (Genus Cyrtopogon) captured an ichneumonid wasp.

This pair flew past us and landed nearby. The wasp was still alive and struggling.
Here's another observation by @sydnianajones of the robber fly and ichneumonid wasp

We found a Formica obscuripes (Western Thatching Ant) nest in a downed tree. In the late morning warmth, the nest was seething with ant activity. We saw similar ant nests in three places on the ridge. In several cases, the ants brought insect larvae into the nest.

Observing Lewisia rediviva (Bitterroot) in this area was a treat.

I was attracted to the large pink flowers and oversampled (18 observations) L. rediviva while on the ridge. Bitterroot was budding and flowering in abundance, and in a few cases, I saw the a href="https://www.inaturalist.org/observations/221729051">desiccated flowers with a cluster of tiny black seeds in the center.

Bitterroots growing under Artemisia were in flower. In contrast, the bitterroot on the open ground was mainly budding.

I first saw the butterfly Coenonympha california (Common Ringlet), widely distributed across North America. I realized this when I saw that a naturalist friend in Vermont had also seen a C. california; it's worth looking at range distribution maps. A bit later in the hike, I saw an Argynnis coronis (Coronis Fritillary) butterfly on the ground; fritillary butterflies were common in this area but challenging to photograph.

Beetles play a role in pollination; I saw a Cortodera subpilosa (flower longhorn beetle on an Erigeron linearis (Desert Yellow Fleabane) flower. The beetle has some pollen grains visible on its elytra (the hard, protective wing covers) and thorax. I also observed flower longhorn beetles (tentative identification Cortodera impunctata) mating on a flowering lupine (probably Lupinus arbutus). Again, pollen is visible on the elytra of both beetles.

Since I was on an Audubon hike, let me close with a bird observation: a Sialia currucoides (Mountain Bluebird) perched in a tree. I photographed this bluebird using what I call diginocing, which is a poor man's Digiscoping, using my binoculars and camera.

It's quite amateur, but I used the equipment I had at hand.

We returned to camp through a woodland route down to Dry Creek and Cascade Camp. It was a great hike; I learned some new things and observed some old friends, such as the bitterroots. Thanks to hike leader Jack and my fellow hikers for an enjoyable 6 hours.
We didn't go very fast (69 minutes per mile) but had a nice Wenas Wilderness sample.

After returning to camp, I had lunch and some reading time (code word for a nap). I also examined a plant display board from the Central Washington Chapter of the Washington Native Plant Society.

Members of the chapter gathered samples of the most common plants in the Wenas area for display. This display board helped reinforce some of the plants I've seen on the hike.

In the late afternoon, Jeff Main played a broad mix of acoustic music for an appreciative audience. Carolyn supplied a popsicle to enhance the music. After that, it was time for dinner and a short late afternoon hike with my friends on Hogback Road. One highlight was a plump Sceloporus occidentalis Western Fence Lizard.

Our evening talk was by Kersti Muul, a conservationist. She discussed her interactions with animals, and I was captivated by her rescue of baby owls and observations of a mother owl over several years. In the morning, I had coffee and breakfast with my friends and journeyed home.

PS - I figured writing a journal entry on the Wenas experience would take me a few days. It turned out to take a month, but I am glad I finished. Thanks to everyone who put together the Wenas campout, old and new friends, and the people who helped me identify and learn from my observations on iNaturalist: @jhorthos, @feralmerrill, @red_wolf, @jaltemus, @markegger and twenty others. See you on the next adventure....

References

[1] Wenas Wildlife Area https://wdfw.wa.gov/places-to-go/wildlife-areas/wenas-wildlife-area
[2] Cascade Park https://www.wta.org/go-hiking/hikes/cascade-park-wenas-wildlife-area
[3] [3] Washington State Wenas Audubon Campout https://wenasaudubon.org/2024-wenas-campout/

[4] Wandering Central Washington: Oak Creek Wildlife Area, an elk-lectic history
By Janell Shah Special to the Yakima Herald-Republic Feb 19, 2024
https://www.yakimaherald.com/explore_yakima/wandering-central-washington-oak-creek-wildlife-area-an-elk-lectic-history/article_3f53aae6-c9ea-11ee-98b4-0f080a37b3e9.html
[5] You can see hundreds of elk graze at this WA wildlife area in winter by Corbin Rieff, Seattle Times 30 January 2024 https://www.seattletimes.com/life/outdoors/you-can-watch-hundreds-of-elk-graze-at-this-wa-wildlife-area-every-winter/
[6] Wenas Wildlife Area, Washington Department of Fish and Wildlife https://wdfw.wa.gov/places-to-go/wildlife-areas/wenas-wildlife-area
[7] Search for Cervus canadensis in Yakima County, Washington
https://www.inaturalist.org/observations?place_id=872&subview=map&taxon_id=204114&verifiable=any
[8] History of Elk — Washington State And Hanford Reach
https://www.fws.gov/story/history-elk-washington-state-and-hanford-reach
[9] Pollinator of the Month: Ornate checkered beetle (Trichoda ornatus) by kiarra13
https://www.inaturalist.org/posts/89030-pollinator-of-the-month-ornate-checkered-beetle-trichoda-ornatus
[10] BEETLES AND POLLINATION by Cerruti R Hooks and Anahí Espíndola
CMNS, Department of Entomology
https://blog.umd.edu/agronomynews/2020/06/29/beetles-and-pollination/
On the importance of beetles as pollinators
[11] E. G. Linsley, J. W. Macswain, Observations on the Life History of Trichodes Ornatus (Coleoptera, Cleridae), a Larval Predator in the Nests of Bees and Wasps, Annals of the Entomological Society of America, Volume 36, Issue 4, 1 December 1943, Pages 589–601, https://doi.org/10.1093/aesa/36.4.589
Found at Cornell Library https://reader.library.cornell.edu/docviewer/digital?id=chla5077679_4204_004#mode/1up
[12] Scat Rap (1988, Andy Bennett, Mary Keebler, Rodd Pemble, Doug Elliott, Billy Jonas)
Found at An Adirondack Naturalist in Central New York website by Ellen Rathbone, November 25, 2009 https://adknaturalist.blogspot.com/2009/11/scat-rap.html
[13] see Astragalus Identification (Washington State)
Relatively jargon-free guide to Washington State Astragalus species. By Jim Thpmas
https://www.inaturalist.org/journal/jhorthos/93957-astragalus-identification-washington-state.
[14] Comment from Jim Thomas https://www.inaturalist.org/observations/221566590
[15] Těšitel J, Plavcová L, Cameron DD. Interactions between hemiparasitic plants and their hosts: the importance of organic carbon transfer. Plant Signal Behav. 2010 Sep;5(9):1072-6. doi: 10.4161/psb.5.9.12563. Epub 2010 Sep 1. PMID: 20729638; PMCID: PMC3115071.https://www.ncbi.nlm.nih.gov/pmc/articles/PMC3115071/

Publicado el 04 de julio de 2024 por brewbooks brewbooks | 104 observaciones | 4 comentarios | Deja un comentario

02 de abril de 2023

Review of Spiders and Their Kin

I found an interesting spider up on Mount Rainier a few years ago. The pale blue egg sac caught my attention. I guessed it was in the wolf spider family, roaming around at 1800 meters (6000 feet). I snapped a few photos and continued on to botanize.
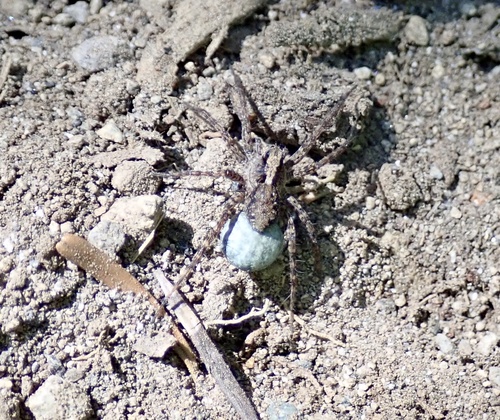

A few months later, I added an observation on iNaturalist . I know this was a wolf spiders (Lycosidae) but not much more. After a few hours, @kathleendobson suggested this spider was in genus Pardosa. Recently (March 2023), @arachnologus (Rod Crawford ) confirmed the ID at the genus level and noted that in Western Washington, only this genus has blue egg sacs. I then asked Rod about how to get to a species level ID. He provided a detailed answer: "... For example, the female above has the pattern of the P. nigra species group and could be any of 3 species on Mt.Rainier. The best thing with an adult female is the almost-impossible closeup of the underside of the abdomen! However, this can potentially be done with a transparent container, but it has to be really close and really in focus."

I asked  Rod to recommend a good beginner's book on spiders. He suggested Spiders and Their Kin by H. W. Levi et al. I ordered a copy of the book, and when it arrived, I noticed it was a Golden Guide, which I had thought of as a children's book. I was wrong! This book was a perfect introduction. It covers land arthropods other than insects, including spiders, scorpions, harvestmen, mites, centipedes, millipedes, and wood lice. The book starts with the classification, anatomy, and behavior of spiders and their kin. 

The book's core is an illustrated review by family of spiders, spider relatives, myriapods, and land crustaceans. It has worldwide coverage. The length of each section varies based on the number of species. For example, orbweavers (Araneidae) cover 19 pages, about 12% of the book. One of my favorite spider observation was an Araneus diadematus (Cross Orbweaver). This spider has taken up residence in a sheltered corner near the front door of my house. I named it Ardi2020. Here's some observation of the same spider, I saw it almost every day:
16 March 2020 25 April 2020 5 May 2020 7 June 2020 I watched this spider maintain its web over several months. Thus, I was happy to find a simple explanation on a two-page spread on how orbweavers build their webs.
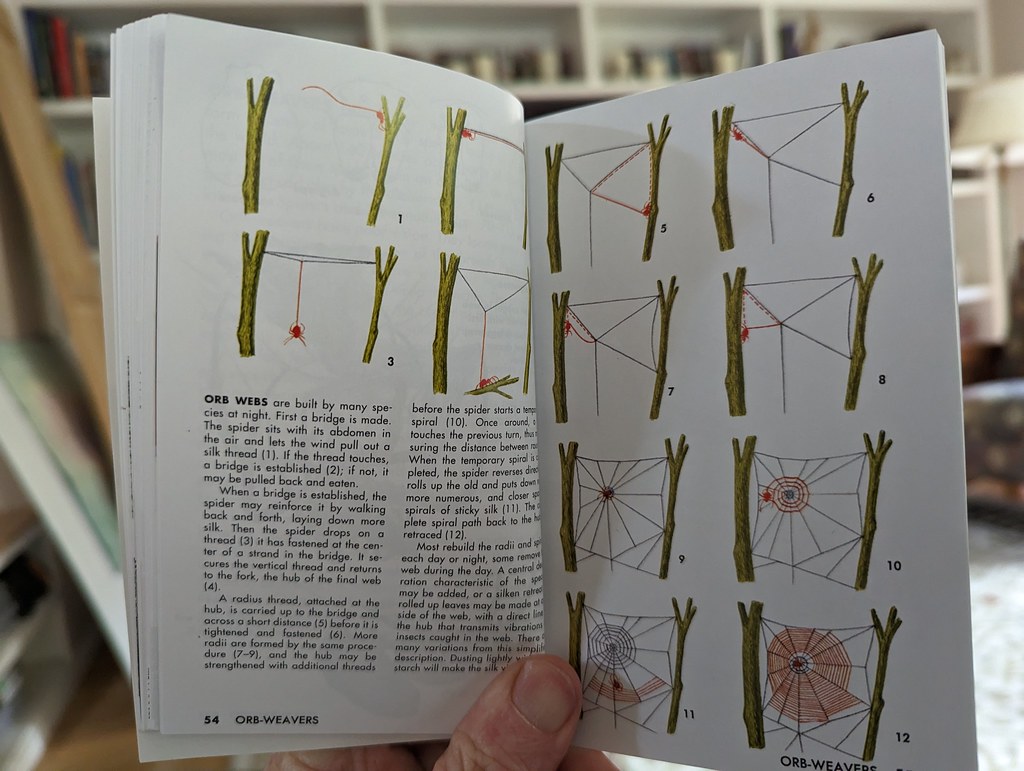
Orb Weavers build webs

The unit on wolf spiders (Lycosidae) helped me understand the behavior of the genus Pardosa. It was just a few sentences but it was useful. If I had looked in this book while making my observation, I might have got my ID to the genus level and realized that species ID was going to be a challenge.

This book will sit beside me while working on my iNaturalist observations of spiders and their relatives. It's a good introduction in 160 pages. One caveat is that this isn't a detailed species identification guide but should be helpful to classify down to the family level.

Thanks to Rod for taking the time to help an amateur naturalist improve.

Publicado el 02 de abril de 2023 por brewbooks brewbooks | 4 comentarios | Deja un comentario

26 de abril de 2020

When do Western Skunk Cabbage flower?

When my local Western Skunk Cabbage (Lysichiton americanus) flowers, I know that spring is near. I try to observe these plants every year around my town (near Seattle, Washington) and up in the Cascade and Olympic mountains.

On trips to British Columbia and Alaska, I also came across these interesting plants. Since I am spending a lot of time at home due to COVID-19 stay home order, I decided to take a closer look at the flowering time and range of these plants.

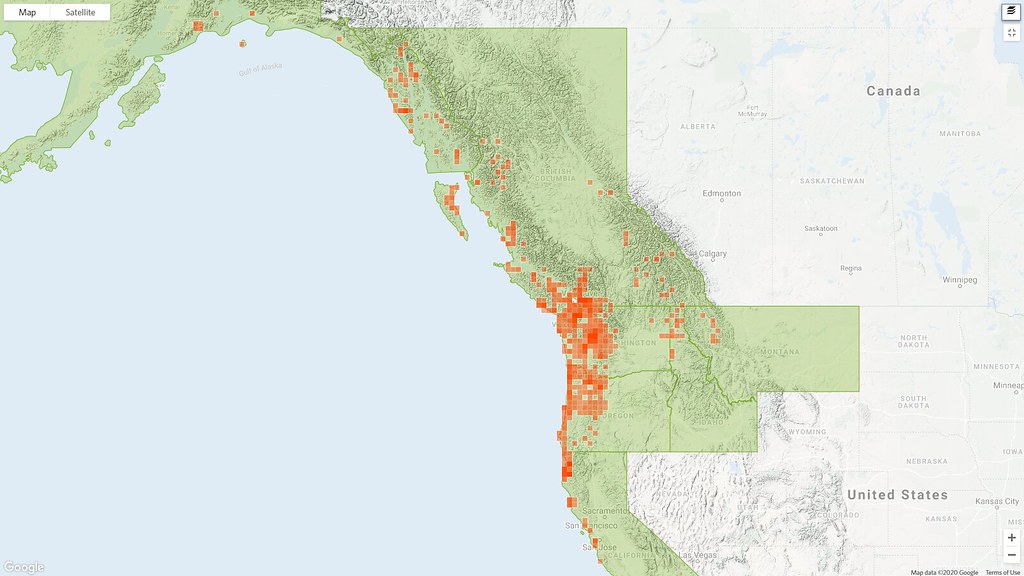
Here's was the distribution of the 3500+ observations in North America (25 April 2020):
WSC_Range

The majority of the observations occur in coastal regions of British Columbia, Washington State, Oregon, northern California and Alaska. There are also observations in Idaho, Montana and central British Columbia. in this post I'll provide some more quantitative data about the geographic distribution and flowering times. One thing I learned is that preponderance of observations are along the coast but there is a disjunct population in the interior of BC, Idaho and Montana. A future endeavor will be to see what's different about the interior population. (Western Skunk Cabbage has naturalized in Europe but I focused on the North American population where it is native.)

When l started looking at the phenology of Western Skunk Cabbage, I found that the phenology attribute (flowering, flower budding, fruiting, no evidence of flowering, no annotation) was generally not set. The figure below shows a graph of the phenology attributes with the available data for the month of April highlighted on 11 April 2020. There were 887 observations in April; only 101 of these observations had the phenology attribute used. The table indicates that only 6% of the 3425 Western Skunk Cabbage research observations available on 11 April 2020 had the phenology attribute set.
WSC_pheno_startZoomWSC_pheno_start_table style=

Since I wanted to know more about when Western Skunk Cabbage flowers I decided it was time to get to work. One goal I've had was to spend more time identifying observations for others on iNaturalist and this was a plant I was pretty familiar with. So, it was time to get to work and start looking at several thousand observations. I did this on a month by month basis starting with April and working one month at a time. It was a bit of a slog on occasion and it took me two weeks to get through.

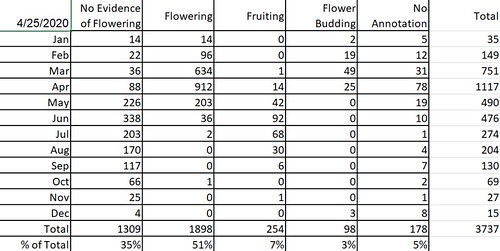
The results are shown in the following figure and table for the 3737 research observations in North America as of 25 April 2020. The flowering peak is in April and the fruiting peak (when the plants are setting seed) is June. The number of observations with no attribute set was reduced from 94% to 5%.
(Please note the color scheme for phenology changed in the two weeks since I started the project, what is annotated below will be consistent for the remainder of this post)
I need to point out many other iNatters have helped with phenology and ID including

WSC_pheno_endmarkupWSC_pheno_end_table

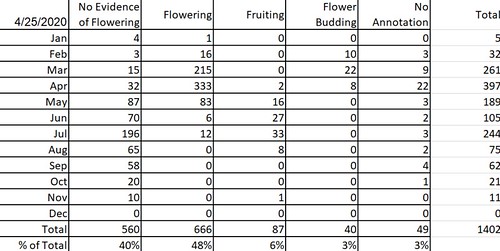
My next question was how does the phenology of Western Skunk Cabbage occur over the geographic distribution. An easy filter was to look at the phenology by state or province.Since British Columbia had the most observations, let me start with this province.

WSC_pheno_BCWSC_pheno_BC_table

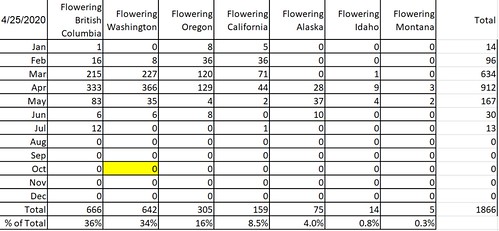
I worked my way through British Columbia, Washington State, Oregon, California, Alaska, Montana and Idaho. The results are summarized in this table:
WSC_pheno_flower_all

The peak Western Skunk Cabbage flowering month for British Columbia and Washington State is roughly mid-April. Oregon's peak is the beginning of April. California's peak is March and Alaska's peak is May. For Montana and Idaho, the data are sparse; not going to make a conclusion. One other note, there's a yellow box in the October cell of Washington State; one observation is listed as flowering but I excised it as an outlier. I did request the person to reconsider their date of observation.

Here's an analysis of the observations Western Skunk Cabbage fruiting on a month by month basis by state or province:
WSC_pheno_fruit_all

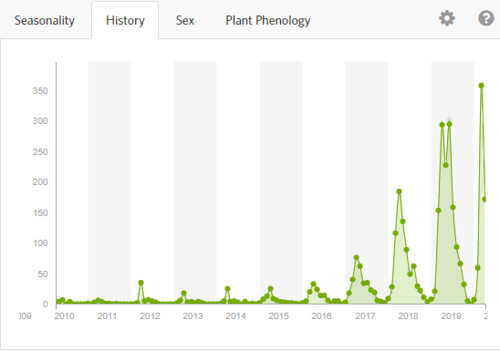
Observations on iNaturalist are increasing over time. In fact, in the few hours I spent gathering the phenology data by state and province, I could see the number of Western Skunk Cabbage observations increasing for the month of April! The following figure and table provide some insight into Western Skunk Cabbage observations over time on iNaturalist:

WSC_pheno_timeWSC_pheno_history

In summary, iNaturalist provides some very useful tools that enabled me to have a reasonable look at the phenology of Western Skunk Cabbage (Lysichiton americanus). In order for the tools to work, it's necessary to use the phenology attribute for each observation and for there to be an adequate amount of observations.

Of course, like an other project, there;s always more that can be done. One idea I want to pursue is to download all the data and then use some better estimates of the peaks for areas where there's a lot of data. Also, anecdotally I note that the blooming times for Western Skunk Cabbage are later in the mountains. I'd like to look at that for Mount Rainier and also for disjunct population in the interior of BC, Idaho and Montana. Once I can botanize on a wider scale again, I think I would like to go have a look over in Idaho and interior BC. Also, I have surveyed some local populations of Western Skunk Cabbage within a few kilometers of my house that I want to observe as they proceed to fruit and disperse seed.
I welcome suggestions, ideas, comments and improvements.

Finally, let me thank @hfb and @etantrah who helped with identifying and setting the phenology attributes often. In addition, thanks to all the people who have observed and identified Western Skunk Cabbage including @ajwright @gwark @brucebennett @hchrish200 @mikepatterson @ewrunn1ng @citizen1 @grnleaf @john8 @stewartwechsler @ rambryum @graysquirrel @spacecowboy @brownsbay @johndreynolds @bstarzomski @mrfish33 @katiekushneryk @jasonheadley @northvandad @kathawk @kg-

Also a shout out to @karoopixie for the very useful post https://www.inaturalist.org/journal/karoopixie/21170-adding-photos-to-journal-and-news-posts

Publicado el 26 de abril de 2020 por brewbooks brewbooks | 10 comentarios | Deja un comentario

11 de julio de 2019

World iNaturalist participation

I was inspired by a comment @mikegrutherford had in the blog post postiNaturalist World Tour. Mike proposed: "As such I was curious about how the list would look if you took a country's land area and/or population into account and then see what the leaderboard looks like. They often do this for the Olympic Games (see http://www.medalspercapita.com/ for an example)."

Here's the data in a way that follows Mike's suggested method. I used the UN list of 233 countries. In a few cases, I had to find the name that iNat uses for the country. I then filtered the all iNat observations country by country as of 10 July 2019. For each country, I recorded the number of observations, species, identifiers and observers (see data at Google Sheet iNat World Observation Analysis 10 July 2019.

I think @mikegrutherford has a great idea on how to view participation per country. The smaller the "Population per Observation" is, the more active the iNaturalist participation in that country. Some very low population countries rose to the top. Of the larger countries, New Zealand (in 6th position) is the clear leader in iNaturalist participation with only 6 people per observation. The United States, with a ranking of 13, is the next largest country. The United States had 23 people per observation; about a quarter of the activity of New Zealand. At the other end of the spectrum, China had people per observation over 30,000 people per observation for a ranking of 219 (out of 233 countries). I'm curious to hear about other naturalists observe in this data (beyond the fact that I like to crunch data and look for patterns).

Population
  Rank
Country or area Population
(1 July 2019)
iNat Obs
(10 July 2019)
Population per
Observation
Population per
Observation Rank
231 Niue 1,615 404 4 1
230 Falkland Islands 3,377 688 5 2
220 Bonaire, Saint Eustatius and
  Saba
25,979 5,086 5 3
221 Palau 18,008 3,334 5 4
233
  Vatican City
799 140 6 5
125 New Zealand 4,783,063 757,905 6 6
222 Cook Islands 17,548 1,792 10 7
232 Tokelau 1,340 131 10 8
211 Saint Kitts and Nevis 52,823 4,873 11 9
205 Cayman Islands 64,948 3,517 18 10
191 Guam 167,294 7,819 21 11
177 Belize 390,353 17,306 23 12
3 United States 329,064,917 14,511,105 23 13
169 Luxembourg 615,729 25,855 24 14
39 Canada 37,411,047 1,514,728 25 15
199 United States Virgin Islands 104,578 3,979 26 16
104 Hong Kong 7,436,154 288,209 27 17
219 British Virgin Islands 30,030 1,075 28 18
88 Portugal 10,226,187 337,344 31 19
227 Saint Helena 6,059 185 33 20
180 Iceland 339,031 10,068 34 21
208 Greenland 56,672 1,653 34 22
55 Australia 25,203,198 622,353 40 23
215 Turks and Caicos Islands 38,191 922 41 24
120 Costa Rica 5,047,561 128,592 42 25
204 Dominica 71,808 1,650 44 26
192 Curaçao 163,424 3,565 46 27
179 Martinique 375,554 7,435 51 28
200 Seychelles 97,739 1,782 55 29
183 New Caledonia 282,750 5,048 56 30
178 Bahamas 389,482 6,951 56 31
209 Commonwealth of the Northern
  Mariana Islands
56,188 975 58 32
165 Bhutan 763,092 12,136 63 33
210 American Samoa 55,312 874 63 34
223 Anguilla 14,869 223 67 35
128 Panama 4,246,439 62,265 68 36
229 Montserrat 4,989 73 68 37
202 Isle of Man 84,584 1,190 71 38
212 Faroe Islands 48,678 615 79 39
10 Mexico 127,575,529 1,603,495 80 40
114 Singapore 5,804,337 70,704 84 41
218 Gibraltar 33,701 401 84 42
185 French Polynesia 279,287 3,232 86 43
206 Bermuda 62,506 713 88 44
207 Marshall Islands 58,791 669 88 45
161 Fiji 889,953 10,058 88 46
198 Aruba 106,314 1,194 89 47
67 Ecuador 17,373,662 188,608 92 48
115 Denmark 5,771,876 62,284 93 49
56 Taiwan 23,773,876 252,007 94 50
24 South Africa 58,558,270 578,075 101 51
145 Botswana 2,303,697 21,989 105 52
228 Saint Pierre and Miquelon 5,822 51 114 53
142 Lithuania 2,759,627 23,742 116 54
143 Namibia 2,494,530 20,709 120 55
23 Italy 60,550,075 500,975 121 56
184 French Guiana 282,731 2,329 121 57
216 Liechtenstein 38,019 309 123 58
139 Puerto Rico 2,933,408 23,256 126 59
68 Netherlands 17,097,130 134,967 127 60
190 Guernsey and Jersey 172,259 1,358 127 61
100
  Switzerland
8,591,365 68,834 127 62
166 Solomon Islands 669,823 5,192 129 63
44 Malaysia 31,949,777 241,321 132 64
79 Belgium 11,539,328 85,651 135 65
201 Antigua and Barbuda 97,118 710 137 66
194 Micronesia 113,815 814 140 67
153 Trinidad and Tobago 1,394,973 9,332 149 68
159 Swaziland 1,148,130 7,504 153 69
21 United Kingdom 67,530,172 428,891 157 70
80 Bolivia 11,513,100 71,059 162 71
213 Sint Maarten 42,388 235 180 72
86 Czech Republic 10,689,209 59,089 182 73
195 Grenada 112,003 613 183 74
189 Saint Lucia 182,790 986 185 75
173 Maldives 530,953 2,718 195 76
149 Slovenia 2,078,654 10,584 196 77
119 Norway 5,378,857 27,334 197 78
29 Colombia 50,339,443 255,389 197 79
197 Saint Vincent and the Grenadines 110,589 545 203 80
182 Barbados 287,025 1,413 203 81
137 Armenia 2,957,731 14,148 209 82
101 Israel 8,519,377 39,933 215 83
164 Guyana 782,766 3,624 216 84
181 Vanuatu 299,882 1,383 217 85
87 Greece 10,473,455 48,352 221 86
171 Suriname 581,372 2,519 231 87
203 Andorra 77,142 328 235 88
97 Austria 8,955,102 39,627 235 89
168 Montenegro 627,987 2,666 236 90
167 Macao 640,445 2,683 239 91
162 Réunion 888,927 3,618 246 92
132 Georgia 3,996,765 15,972 250 93
22 France 65,129,728 250,005 261 94
130 Croatia 4,130,304 15,610 265 95
187 Sao Tome and Principe 215,056 798 269 96
30 Spain 46,736,776 171,149 273 97
91 Sweden 10,036,379 36,380 276 98
214 Monaco 38,964 141 276 99
124 Ireland 4,882,495 17,603 280 100
175 Malta 440,372 1,561 282 101
158 Cyprus 1,179,551 4,012 294 102
176 Brunei 433,285 1,387 312 103
196 Tonga 110,940 345 322 104
140 Albania 2,880,917 8,798 327 105
217 San Marino 33,860 101 335 106
17 Germany 83,517,045 243,627 343 107
116 Finland 5,532,156 15,898 363 108
174 Guadeloupe 447,905 1,188 377 109
172 Cape Verde 549,935 1,448 380 110
63 Chile 18,952,038 48,732 389 111
193 Kiribati 117,606 300 392 112
186 Mayotte 266,150 647 411 113
188 Samoa 197,097 476 414 114
110 Nicaragua 6,545,502 14,567 465 115
157 Mauritius 1,198,575 2,470 485 116
93 Honduras 9,746,117 19,982 489 117
117 Slovakia 5,457,013 11,022 502 118
155 Estonia 1,325,648 2,520 526 119
31 Argentina 44,780,677 84,674 529 120
99 Serbia 8,772,235 16,142 544 121
9 Russia 145,872,256 261,690 557 122
51 Madagascar 26,969,307 45,814 589 123
156 East Timor 1,293,119 2,174 595 124
28 South Korea 51,225,308 84,816 604 125
43 Peru 32,510,453 52,686 617 126
95 Belarus 9,452,411 15,520 624 127
107 Bulgaria 7,000,119 10,671 660 128
85 Dominican Republic 10,738,958 15,276 711 129
148 Macedonia 2,083,459 2,884 722 130
138 Jamaica 2,948,279 3,794 777 131
81 Cuba 11,333,483 14,658 785 132
134 Uruguay 3,461,734 4,319 802 133
224 Tuvalu 11,646 11 1,059 134
144 Gambia 2,347,706 2,153 1,090 135
92 United Arab Emirates 9,770,529 9,156 1,096 136
58 Sri Lanka 21,323,733 19,004 1,122 137
94 Hungary 9,684,679 8,413 1,158 138
170 Western Sahara 582,463 479 1,216 139
151 Latvia 1,906,743 1,545 1,234 140
6 Brazil 211,049,527 164,860 1,280 141
38 Poland 37,887,768 29,424 1,288 142
61 Romania 19,364,557 14,782 1,310 143
77 Benin 11,801,151 8,914 1,324 144
146 Gabon 2,172,579 1,579 1,376 145
106 Paraguay 7,044,636 5,046 1,421 146
27 Kenya 52,573,973 35,555 1,479 147
74 Zimbabwe 14,645,468 9,149 1,601 148
122 Oman 4,974,986 2,972 1,676 149
25 Tanzania 58,005,463 33,967 1,708 150
33 Ukraine 43,993,638 24,895 1,767 151
226 Nauru 10,756 6 1,793 152
66 Guatemala 17,581,472 9,653 1,821 153
20 Thailand 69,037,513 37,824 1,825 154
65 Zambia 17,861,030 9,280 1,925 155
136 Mongolia 3,225,167 1,636 1,971 156
111 El Salvador 6,453,553 3,270 2,002 157
11 Japan 126,860,301 63,196 2,007 158
89 Jordan 10,101,694 4,399 2,325 159
34 Algeria 43,053,054 18,186 2,367 160
129 Kuwait 4,207,083 1,752 2,401 161
135 Bosnia and Herzegovina 3,301,000 1,311 2,518 162
141 Qatar 2,832,067 1,004 2,821 163
62 Malawi 18,628,747 6,500 2,866 164
147 Lesotho 2,125,268 731 2,907 165
105 Laos 7,169,455 2,417 3,077 166
121 Palestine 4,981,420 1,540 3,278 167
118 Republic of Congo 5,380,508 1,631 3,346 168
4 Indonesia 270,625,568 79,614 3,399 169
70 Cambodia 16,486,542 4,676 3,526 170
64 Kazakhstan 18,551,427 5,209 3,561 171
18 Turkey 83,429,615 23,420 3,562 172
13 Philippines 108,116,615 27,487 3,933 173
98 Papua New Guinea 8,776,109 2,244 3,991 174
46 Mozambique 30,366,036 7,353 4,130 175
40 Morocco 36,471,769 8,511 4,285 176
49 Nepal 28,608,710 6,636 4,311 177
82 Haiti 11,263,770 2,416 4,691 178
150 Guinea-Bissau 1,920,922 400 4,802 179
112 Kyrgyzstan 6,415,850 1,313 4,915 180
32 Uganda 44,269,594 7,948 5,570 181
108 Lebanon 6,855,713 1,256 5,573 182
71 Senegal 16,296,364 2,850 5,718 183
154 Equatorial Guinea 1,355,986 230 5,896 184
15 Vietnam 96,462,106 15,619 6,176 185
96 Tajikistan 9,321,018 1,468 6,439 186
54 Cameroon 25,876,380 3,728 6,941 187
50 Venezuela 28,515,829 3,974 7,176 188
152 Bahrain 1,641,172 224 7,327 189
76 Rwanda 12,626,950 1,503 8,401 190
48 Ghana 28,833,629 3,299 8,740 191
78 Tunisia 11,694,719 1,318 8,873 192
16 Democratic Republic of the Congo 86,790,567 9,692 8,955 193
45 Angola 31,825,295 3,252 9,786 194
2 India 1,366,417,754 126,873 10,770 195
103 Sierra Leone 7,813,215 750 10,776 196
225 Wallis and Futuna 11,432 1 11,432 197
59 Burkina Faso 20,321,378 1,764 11,520 198
160 Djibouti 973,560 83 11,730 199
90 Azerbaijan 10,047,718 792 12,755 200
14 Egypt 100,388,073 7,169 14,003 201
163 Comoros 850,886 60 14,181 202
36 Iraq 39,309,783 2,699 14,565 203
12 Ethiopia 112,078,730 7,101 15,784 204
126 Central African Republic 4,745,185 296 16,031 205
57 Niger 23,310,715 1,314 17,740 206
131 Moldova 4,043,263 219 18,462 207
123 Liberia 4,937,374 254 19,587 208
41 Saudi Arabia 34,268,528 1,714 19,993 209
75 Guinea 12,771,246 616 20,733 210
5 Pakistan 216,565,318 9,698 22,331 211
19 Iran 82,913,906 3,534 23,462 212
102 Togo 8,082,366 355 23,998 213
42 Uzbekistan 32,981,716 1,336 24,687 214
52 North Korea 25,666,161 970 26,460 215
109 Libya 6,777,452 240 28,565 216
69 Syria 17,070,135 585 29,180 217
53 Côte d'Ivoire 25,716,544 872 29,491 218
1 China 1,433,783,686 47,654 30,087 219
72 Chad 15,946,876 513 31,086 220
127 Mauritania 4,525,696 133 34,028 221
26 Myanmar 54,045,420 1,539 35,117 222
83 South Sudan 11,062,113 316 35,645 223
7 Nigeria 200,963,599 4,534 44,324 224
113 Turkmenistan 5,942,089 120 53,465 225
47 Yemen 29,161,922 541 53,904 226
60 Mali 19,658,031 359 54,758 227
133 Eritrea 3,497,117 43 81,328 228
73 Somalia 15,442,905 158 97,740 229
84 Burundi 10,864,245 105 105,353 230
8 Bangladesh 163,046,161 1,101 148,089 231
37 Afghanistan 38,041,754 216 176,119 232
35 Sudan 42,813,238 187 228,948 233
World 7,710,537,362 26,796,726 288
Publicado el 11 de julio de 2019 por brewbooks brewbooks | 7 comentarios | Deja un comentario

27 de junio de 2019

US regional iNaturalist participation

I built an observation metric to understand what US regions have more or less observations compared to the overall population. (More detail in this post iNaturalist participation across the United States.) For each Census bureau division, I found how many observations existed (as of 23 June 2019) and also computed the sum of all observations for the United States. From this, I calculated % total US iNat observations Next, I computed the percent of the US population in the division. Finally, I computed a metric of observations as % total iNat US observations/ % total US population.


Region Division Population estimate, 2018 % total US population iNat Observations (23 June 19) % total US iNat observations (23 June 2019) % total iNat observations/ % total population Rank
 West Pacific 53,441,278 16.2% 3,957,722 30.7% 1.9 1
 South West South Central 40,318,727 12.2% 2,296,972 17.8% 1.5 2
 Northeast New England 14,853,290 4.5% 761,005 5.9% 1.3 3
 West Mountain 24,552,385 7.4% 919,914 7.1% 1.0 4
 South South Atlantic 65,322,408 19.8% 1,856,532 14.4% 0.7 5
 South East South Central 19,112,813 5.8% 507,656 3.9% 0.7 6
 Northeast Mid-Atlantic 41,257,789 12.5% 1,030,636 8.0% 0.6 7
 Midwest East North Central 46,931,883 14.2% 1,132,770 8.8% 0.6 8
 Midwest West North Central 21,376,861 6.5% 406,606 3.2% 0.5 9
 None None 3,576,620 1.1% 31,276 0.2% 0.2 10


Using the Pacific division of the West region as an example, there were 3,957,722 observations out of 12,901,089 total observations which is 30.7% of all US iNat observations. The Pacific division population of 53,441,278 comprise 16.2% of the total US population. I divided the Pacific's 30.7% of all US iNat observations by the 16.2% of the total US population and computed that the Pacific has 1.9 times more observations than overall for the US.

At a regional level, the Pacific division leads with a 1.9 observation metric, that means that these states contribute about twice the observations as compared to the overall US population.. The states (and observation metric) that comprise the Pacific division are: Alaska (2.7), California (2.1), Hawaii (1.7), Oregon (1.3), and Washington (0.9) In this case, almost all the states were above the overall US. The exception was my home of Washington State, the laggard of the Pacific division.

Next, the West South Central division had a 1.5 observation metric. The states (and observation metric) that comprise the West South Central division are: Arkansas(0.6), Louisiana (0.7), Oklahoma (0.6), and Texas (1.8). In this case, the strong performance by Texas naturalists (about 3/4 of the West South Central division population) brings up the performance of the division.

The New England division had a 1.3 observation metric. The states (and observation metric) that comprise the New England division are:Connecticut (0.5), Maine (1.6), Massachusetts (1.0), New Hampshire (1.0), Rhode Island (0.4), and Vermont (11.2). I'm mighty curious as to why Vermont has such a high metric; we all have something to learn from them.

On the other end of the spectrum, the entire midwest region was well behind the rest of the United States. Here are states (observation metrics) for the Midwest region:
East North Central (0.6): Illinois(0.6), Indiana (0.4), Michigan(0.5), Ohio (0.9), and Wisconsin (0.6)
West North Central (0.5): Iowa (0.2), Kansas (0.4), Minnesota (0.8), Missouri (0.4), Nebraska (0.3), North Dakota (0.3), and South Dakota (0.4) As an aside, I've had recent opportunity to explore some of the midwest region and have found it might interesting.

Finally, the regions not covered in the US Census divisions had an observation metric of 0.2 These comprised: Guam (1.1), U.S. Virgin Islands (0.8), Northern Mariana Islands (0.5), American Samoa (0.4) and Puerto Rico (0.2) The low metric for Puerto Rico caused the overall metric to be low; because Puerto Rico has almost 90% of the population of this region.

I spent time thinking about an observation metric because I wanted to learn more about the iNaturalist population in the US but I'm also quite curious to understand how this data looks for the world. After all, we all live on Spaceship Earth. I'm heartened to see the iNaturalist staff and community starting to look at how we can use this wonderful tool across the globe.
Sources

I assembled statistics state by state using data from the Biodiversity projects from each state (as of 23 June 2019), thanks @zoology123 along with current 2018 population estimates(see iNaturalist US observation Analysis 23 June 2019

Census Bureau-designated regions and divisions
Region 1: Northeast
Division 1: New England (Connecticut, Maine, Massachusetts, New Hampshire, Rhode Island, and Vermont)
Division 2: Mid-Atlantic (New Jersey, New York, and Pennsylvania)

Region 2: Midwest (Prior to June 1984, the Midwest Region was designated as the North Central Region.)
Division 3: East North Central (Illinois, Indiana, Michigan, Ohio, and Wisconsin)
Division 4: West North Central (Iowa, Kansas, Minnesota, Missouri, Nebraska, North Dakota, and South Dakota)

Region 3: South
Division 5: South Atlantic (Delaware, Florida, Georgia, Maryland, North Carolina, South Carolina, Virginia, District of Columbia, and West Virginia)
Division 6: East South Central (Alabama, Kentucky, Mississippi, and Tennessee)
Division 7: West South Central (Arkansas, Louisiana, Oklahoma, and Texas)

Region 4: West
Division 8: Mountain (Arizona, Colorado, Idaho, Montana, Nevada, New Mexico, Utah, and Wyoming)
Division 9: Pacific (Alaska, California, Hawaii, Oregon, and Washington)

Puerto Rico and other US territories are not part of any census region or census division
Source: https://en.wikipedia.org/wiki/List_of_regions_of_the_United_States#Census_Bureau-designated_regions_and_divisions accessed 25 June 2019

Publicado el 27 de junio de 2019 por brewbooks brewbooks | 3 comentarios | Deja un comentario

iNaturalist participation across the United States

Recently, I spent some time examining the umbrella project Biodiversity of The United States, by State ; created by @zoology123 This project collects observations across the 50 states and 15 territories of the United States. I was curious about how many states and territories I had made observations in (27 states and 1 territory). Here was my top 10 as of 23 June 2019:

Biodiversity of My Obs My Rsrch
Obs
My Rsrch
 %
My Species My Rank
  Washington 3,500 2,720 78% 861 7
  Arizona 490 380 78% 166 80
  Utah 278 193 69% 103 49
  Wyoming 164 53 32% 86 17
  Alaska 139 104 75% 86 58
  Oregon 115 69 60% 66 257
  Idaho 78 34 44% 41 121
  Montana 73 37 51% 38 88
  New Jersey 67 28 42% 38 352
  Nebraska 62 37 60% 33 63


I started dredging around in my massive Google, Flickr and iCloud photo dumps and found a few more states (Kansas and New Hampshire) that I was able to add observations from. There's more gems in the photo archives to be mined; anyone else have a similar problem?

After this, I was curious to see how observations varied across the United States. I assembled statistics state by state using data from the Biodiversity projects from each state (as of 23 June 2019), thanks @zoology123 along with current 2018 population estimates (see iNaturalist US observation Analysis 23 June 2019

I built an observation metric to understand what states have more or less observations compared to the overall population. For each state, I found how many observations existed for the state and also computed the sum of all observations for the United States. From this, I calculated % total US iNat observations Next, I computed the percent of the US population in the state. Finally, I computed a metric of observations as % total iNat US observations/ % total US population.

Using Vermont as an example, there were 274,545 observations out of 12,901,089 total observations which is 2.13% of all US iNat observations. Vermont's population of 626,299 comprise 0.19% of the total US population. I divided Vermont's 2.13% of all US iNat observations by Vermont's 0.19% of the total US population and computed that Vermont has 11.2 times more observations than overall for the US. Alaska, California, Texas, Hawaii, and Maine are also leaders in iNaturalist observations. On the other end of the spectrum are North Dakota, Georgia, Nebraska, Iowa, and Puerto Rico.

Here's a look at the data I compiled and some additional detail:


Name Population estimate, 2018 Population Rank % total US population iNat Observations (23 June 19) % total US iNat observations (23 June 2019) % total iNat observations/ % total population Rank Census Bureau-designated region Census Bureau-designated Division
 Vermont 626,299 51 0.19% 274,545 2.1% 11.2 1 Northeast New England
 Alaska 737,438 48 0.22% 78,713 0.6% 2.7 2 West Pacific
 California 39,557,045 1 11.96% 3,295,194 25.5% 2.1 3 West Pacific
 Texas 28,701,845 2 8.68% 2,004,452 15.5% 1.8 4 South West South Central
 Hawaii 1,420,491 41 0.43% 92,740 0.7% 1.7 5 West Pacific
 Maine 1,338,404 42 0.40% 83,130 0.6% 1.6 6 Northeast New England
 District of Columbia 702,455 50 0.21% 42,201 0.3% 1.5 7 South South Atlantic
 New Mexico 2,095,428 37 0.63% 123,506 1.0% 1.5 8 West Mountain 
 Wyoming 577,737 52 0.17% 31,613 0.2% 1.4 9 West Mountain 
 Oregon 4,190,713 27 1.27% 214,269 1.7% 1.3 10 West Pacific


I also computed a regional metric using classifications developed by the US Census Bureau. I'll write that up in a separate post.

Some Notes on sources and methodology

I accessed Biodiversity of The United States, by State over the course of 8 hours during 23 June 2019. I gathered data satate by state by examining the number of observations for each state's project starting with https://www.inaturalist.org/projects/biodiversity-of-alabama
As an aside, I looked at other data for each state such as number of research observations, number of species, number of identifiers, number of observers, That's more grist for the mill, it was quite interesting to observe this data.

For each state and territory, I found the 2018 estimate of population from Wikipedia simple.wikipedia.org/wiki/List_of_U.S._states_by_population.

I excluded some of the smallest US territories: Guantanamo Bay Naval Base, Howland Island and Baker Island, Jarvis Island, Johnston Atoll, Kingman Reef, Midway Atoll, Navassa Island, Wake Island, and Antarctic US Bases since I did not have a reliable 2018 estimate of the population.

Publicado el 27 de junio de 2019 por brewbooks brewbooks | 4 comentarios | Deja un comentario

Archivos

Vida Silvestre es una entidad asociada a la Organización Mundial de Conservación